How it works
LIME Insights is used to set up goals on activity levels and values found at the project/business card. You can set goals on coworkers and group coworkers to summarize goals in the display view. All goals are set on coworkers on a monthly basis. In order to calculate your daily goal the widget divides the total goal with number of days in the month and the multiplies it with the actual day.
Goals on activity
You can choose to measure activities from the history. Typically you measure activities such as sales calls and customer visits. Important to
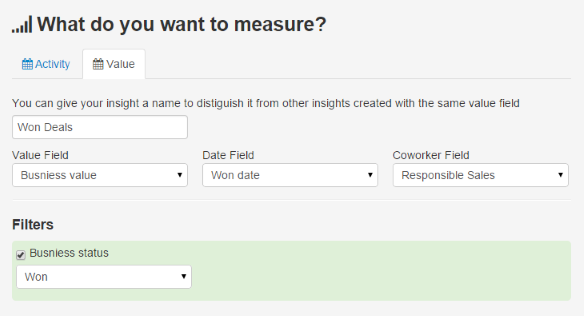
Goals on values
LIME Insights can summarize values from the company or project/business card. Give your Insight a name in order to distinguish it from others if you use the same value field multiple times. Choose a integer or decimal field from the field list and then choose a date and coworker field that will be connected to the Insight. If you want you can now add simple filter by choosing a option field and a certain option.
Example: You want to set goals on won deals.
Presentation
Each Insight is presented as one widget and if clicked you can drill down and see the outcome per group and/or coworker.
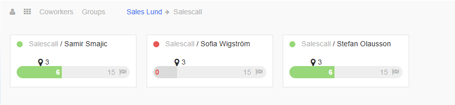
Each widget has a total monthly goal which is divided into daily goals. If you reach your daily goal the widget will be presenting a green bar. In the picture above you can see that we have a total goal of 15 sales calls for each coworker and in order to reach this monthly goal we need to do 3 sales calls until this day. The coworker that has done zero sales calls will have a red widget and the other two are green since they have done 6 sales calls.
TV mode
All available insights can be displayed and you can choose which to be displayed in the slideshow. Press “Play” to start the slideshow.
If the web browser doesn't enter full-screen mode automatically, press F11 in your browser then reload the page (F5). The reload will make sure that all elements are sized properly.
The slideshow will automatically update Insights.
Underneath the insight-card circular markers are used to indicate the colors of the corresponding Insights, in this way you can get an overview of the company status with a quick glimpse at the screen.